event:decision
  • Home
  • Our Products
    • Track
    • Impact
    • Navigator
    • Evolve
  • About Us
    • Our Company
    • Clients
  • Resources
    • Responsible Futures
    • Blog
    • Responsible Agency Index
  • Contact Us
  • Client Login
  • Search
  • Menu Menu
  • LinkedIn
  • Instagram

Sustainability ranks last. That’s your opening.

October 21, 2026/in Event:Decision Content, Impact, Track

Based on the ICEN Annual Benchmarking Report 2026/27.

A new survey of in-house corporate event professionals has an uncomfortable finding for anyone in our corner of the industry. Sustainability comes last.

The ICEN Annual Benchmarking Report 2026/27 asked 115 corporate event professionals to rank their planning priorities. Sustainability, which it defines as CO2 tracking and waste reduction, came 9th out of 9. Only 16% rated sustainability requirements and reporting as a significant challenge for the next 12 months. It was the lowest of every challenge listed.

It would be easy to read that as “nobody cares”. We think the rest of the report says something more useful.

The real problem is measurement

Look at what teams are worried about. 85% rate budget pressure and cost scrutiny as a major challenge. 82% say the same of proving ROI and commercial value. The objection event teams hear most often is “we can’t measure the ROI”, reported by 45%.

Senior leaders aren’t the obstacle. 79% of respondents say their senior stakeholders believe strongly in the value of events. But only 13% find budgets easy to approve. The report’s diagnosis is that events have a currency problem, not a value problem. Leaders agree events matter, but they won’t sign off without numbers they trust.

Most teams are stuck at the same point. 83% measure registrations or attendance, and only 34% attribute revenue. Attendance tells you who turned up. It doesn’t tell finance what the event delivered.

Sustainability has the same problem

Carbon data for events has a lot in common with ROI data. It’s often collected late, can be estimated, and reported once the event is over. It rarely uses a method the finance team recognises. That makes it easy to rank last, because it feels like an extra task rather than a source of evidence.

The report points to what changes this, and it applies to carbon as much as to pipeline:

  • Write the definition down. Teams with a documented engagement scoring model rate their pipeline evidence 3.71 out of 5. Teams without one rate it 2.82. Informal tracking sits close to having no model at all.
  • Connect the data. Teams whose event data flows into their CRM rate their evidence 3.78. Teams moving data by hand rate it 2.48.
  • Measure the whole portfolio. Easy budget approval is 22% for teams running 30 or fewer events a year and 4% for teams running 60 or more. The report’s answer is one set of measures applied to every event, rather than a separate story for each.

The report calls for a standard rather than a tool. A shared, documented method is what makes numbers credible to the people who control budgets. We agree.

What this means for responsible events

We read the findings this way.

Stop using sustainability as a separate agenda. If carbon and waste (not the most exciting of factors) rank last in a list of priorities, a standalone sustainability pitch will keep ranking last. The priorities that rank first are content quality, ROI and measurement, and delivering on wider business KPIs. ESG (NOT carbon) data earns its place by serving those: consistent, comparable and defensible evidence about what an event cost and what it delivered.

Treat carbon AND social value like any other event measure. You’re already delivering social value in delivering events as they are. You’re just not measuring it and showing it as brand-generated value. Both social and carbon should use an agreed method and be reported after every event. It should be comparable across a programme, and someone should own it. That is the same advice the report gives for ROI.

Plan for the portfolio, not the one-off. For teams running dozens of events a year, a single flagship impact report doesn’t help. A consistent method across both factors every event does – and demonstrates your team and event value.

Expect the gap to close. The report shows sustainability reporting as a low-ranked skill and training budgets as scarce, with only 19% of organisations running a structured programme. Regulation and client disclosure requirements aren’t waiting for event teams to catch up. Teams with a measurement habit in place will be better placed when the questions come. Which they will. Seen it from several global corporates this month alone.

A note on the data

This was a small sample of 115 respondents, weighted towards finance and banking (47%) and technology (26%), and to the UK (52%). The sustainability question was narrow, so it may understate interest in wider reporting requirements. So the report is not a verdict on the whole market.

The takeaway

The profession is asking for defensible numbers. Sustainability sits low on the list partly because it hasn’t yet been presented as one.

At event:decision, that’s the case for measuring carbon and social value as rigorously as anything else: a documented method, consistent across events, and clear enough to stand up in a budget conversation. When teams can show that, a sustainable and responsibly delivered program stops being an extra and starts being part of the evidence.

If you’re building a measurement framework for your events programme, we’d be glad to talk.


https://eventdecision.com/wp-content/uploads/2026/10/Screenshot-2026-10-21-at-19.47.21.png 1164 1980 Matt Grey https://eventdecision.com/wp-content/uploads/2026/04/mainlogo-ed.png Matt Grey2026-10-21 19:57:542026-10-21 19:57:54Sustainability ranks last. That’s your opening.

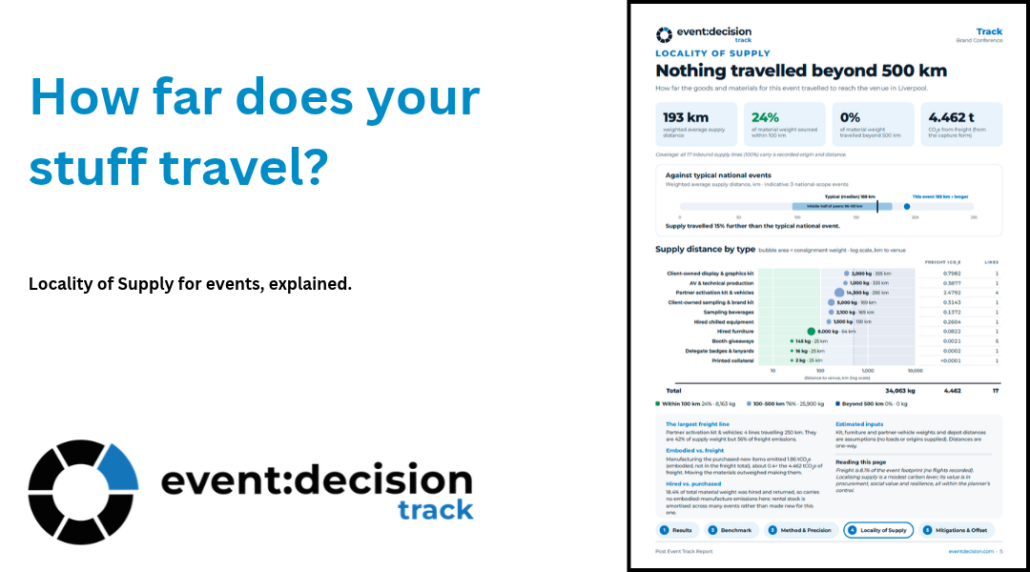
How far does your stuff travel?

October 20, 2026/in event:decision, Track

Locality of Supply, explained

Where the staging, furniture, print and gifts for an event come from says a lot about its sustainability, and now your Track report shows it.


Why Locality of Supply matters

When we talk about event sustainability, delegate travel and venue energy get most of the attention. But the physical stuff an event needs, such as staging, AV, furniture, florals, print and gifting, has a footprint of its own, and it also has a story: who supplied it, and from where?

Locality of Supply (LOS) answers one simple question: how far did the goods and materials for this event travel to reach the venue?

It is a key driver of event sustainability for three reasons.

1. Local spend keeps value in the community. Every pound spent with a supplier near the venue supports local jobs, local skills and local businesses. It is also what social value frameworks, such as the UK’s TOMs, score and procurement teams are asked to report against.

2. It builds a legacy beyond the event. Local suppliers, hired stock and reused materials leave something behind: lasting supplier relationships, an established local supply base for the next event, and fewer one-off items shipped in and thrown away.

3. It is within the planner’s control. You can’t easily change where delegates live, but you can choose where the furniture is hired, who prints the signage and how far the AV travels.

A note on honesty: freight is usually a modest share of an event’s carbon footprint. In the events we’ve measured it ranges from well under 1% to around a tenth of the total. Localising supply is not a silver bullet for emissions. Its strength is in procurement, social value and supply-chain resilience, and it often reveals a bigger lever: what was specified (new or reused, hired or bought) can matter more than how far it travelled.

How a Track report shows it

Every Track report now includes a one-page Locality of Supply view, built from the freight data we already calculate, with no extra work for you.

  • One headline number: the weighted average supply distance. It is calculated as total tonne-kilometres divided by total tonnes, so a heavy AV load counts for more than a small print delivery. It is the fairest single figure for comparing events.
  • A clear dot plot, with one row per supply type (AV, furniture, print and so on) showing how far each travelled and how heavy it was. Supplier names are never shown, only categories.
  • A simple distance split: how much of the material weight came from within 100 km, from 100 to 500 km, and from beyond 500 km.
  • Honest coverage. Where a supplier’s origin wasn’t recorded we show it in grey, never as “nearby”.

How did you perform? The benchmark

A distance on its own doesn’t mean much: 150 km is excellent for an international summit and long for a local launch. So the page compares your event with typical events of the same audience scope: local, regional, national or international.

A simple track shows the middle half of comparable events as a shaded band, with the median marked as a tick and your event as a dot, plus a plain-English caption such as “Supply travelled 15% further than the typical national event.”

From our first dozen events with LOS, the early typical (median) weighted average supply distances are:

Audience scope Typical supply distance
Local about 24 km
Regional about 41 km
National about 170 km
International about 310 km

These are early figures from a small set of events, so we label them as indicative. They will sharpen as more events are added. One thing already stands out: international audiences don’t always mean international supply. Several of our international events sourced almost everything in the host city.

What to do with it

Use your Locality of Supply page to ask better questions of your supply chain: Could the longest-travelled item have come from closer? Could more be hired locally or reused? Would suppliers share origin postcodes next time, so we can show where the goods came from as well as how far?

Better data makes a better page, and a better page makes a stronger case for procurement, social value and the legacy your event leaves behind.

Want to see Locality of Supply in your own Track report? Get in touch with the event:decision team.

https://eventdecision.com/wp-content/uploads/2026/10/LOS-explainer.png 600 1080 Matt Grey https://eventdecision.com/wp-content/uploads/2026/04/mainlogo-ed.png Matt Grey2026-10-20 14:21:342026-10-20 14:22:11How far does your stuff travel?

Sustainability is business as usual?

October 14, 2026/in event:decision, Event:Decision Content

Sustainability is business as usual?

14 Oct 2026 ·

Amex GBT’s 2027 Global Meetings and Events Forecast describes sustainability as “baked-in” and “business-as-usual” for a modern meetings programme.

We think that raises a hard question: if everyone is doing it, can anyone prove it? Matt Grey, event:decision.

The forecast surveyed 500 meeting professionals in eleven countries. Its message on sustainability is clear. Attendees expect to see it, planners have it on the agenda, but the gap is increasingly about evidence rather than intent.

What the forecast says

Sustainability metrics are a stated priority (page 7). When asked about priorities for the year ahead, respondents included “improving/incorporating sustainability initiatives and metrics” in their top six. Note the word metrics. It sits next to initiatives, not behind them.

Attendees are watching (page 30). The report notes that sustainability has anecdotally “fallen down the agenda”, but says its data does not show that. Meeting professionals told YouGov that attendees expect to see visible sustainability measures, and that this is the number one way attendee expectations have changed in the last two years.

The priorities are practical (page 30). The top sustainability, accessibility and inclusion priorities for 2027 are:

  1. Accessibility, such as accessible transport and wheelchair-friendly venues (47%)
  2. Inclusion and culture, such as gender-neutral bathrooms and dietary requirements (40%)
  3. Sustainable food and beverage: local, seasonal, plant-based
  4. Catering that complies with different diets and restrictions
  5. Minimising disposables and prioritising sustainable materials and production

Two things stand out. Sustainability and social value now sit in the same conversation as accessibility and inclusion. And the sustainability actions on the list are visible ones: what is on the plate, what is in the bin, what the stage is built from.

Visible is not the same as measured.

In other news: Is Scope 3 is moving from ‘spend’ to ‘consumption’?

Several global corporations are changing how they account for Scope 3 emissions from events, meetings and business travel. Is the direction of travel is from spend-based methods to consumption-based ones?

What’s the difference?

Spend-based Consumption-based
Input Money spent on the event What was actually used: kWh, litres, kg, km, meals, room nights
Method Spend × a generic emission factor for the category Quantity × a specific emission factor
What it shows A rough, top-down estimate A bottom-up footprint tied to real decisions
Effect of a better choice Often none. A plant-based menu costs the same, so the number barely moves Visible. The change shows up in the result
Effect of paying more Emissions rise, even if the supplier is greener Emissions reflect what was bought, not what it cost

Spend-based accounting is a sensible starting point when nothing else is available.

Its weakness is that it cannot reward good practice, because price is a poor proxy for impact.

As corporate targets tighten and reporting is scrutinised, that weakness becomes harder to defend.

What this means for venues. A client who needs consumption data will ask the venue for it. That means metered energy for the event days, waste by stream, water, and the carbon intensity of the food served. Venues that can supply this become easier to select. Venues that can’t become a gap in the client’s inventory.

What this means for agencies. Agencies hold much of the activity data: delegate travel, accommodation, freight, production materials, catering volumes. If that data is collected at the end of the event, from invoices, it arrives as spend. If it is planned for at the start, it arrives as consumption.

The agency that sets up measurement at briefing stage is the one that can hand clients a defensible number.

The measurement gap

Put the two threads together. The forecast shows planners prioritising sustainability metrics and attendees expecting visible action. Corporate Scope 3 methods are shifting towards data that only venues and agencies can supply. The people being asked for that data are, in many cases, not yet set up to give it.

The Latin America findings on page 34 show the pattern at regional scale. Sustainability leads as a deciding factor in destination choice there more than in any other region, yet meeting professionals are the least likely to measure emissions. Intent is high; instrumentation is low. We suspect that gap is not unique to one region.

What good looks like:

  • Measurement planned at briefing, not reconstructed at close. Agree what will be captured, from whom, and in what units before the event is booked.
  • Venue data in the contract. Energy, waste, water and food data for the event days, requested in the RFP and written into the agreement.
  • Activity data over invoices. Delegate travel by mode and distance, room nights, meals by type, freight and materials by weight.
  • A footprint that responds to decisions. If switching to a local, plant-based menu or a shorter supply chain does not change the number, the method is not measuring what you control.
  • Social value alongside carbon. The accessibility and inclusion priorities on page 30 are part of the same story. They deserve evidence too, not only emissions.

What to do now

If you buy events, ask your agency and venues how they will report consumption data, not only spend, and put it in the brief.

If you deliver events, find out which of your suppliers can already give you itemised data and which cannot. The 2027 forecast tells us sustainability is staying on the agenda. The next competitive edge is being able to show the numbers behind it.

At event:decision, measurement is what we do. We can help you build consumption-based data capture into your next event from the brief onwards. Get in touch to talk it through.

Source: American Express Global Business Travel, 2027 Global Meetings and Events Forecast (YouGov survey of 500 meeting professionals in eleven countries, fieldwork August 2026), pages 7, 27, 30 and 34.

https://eventdecision.com/wp-content/uploads/2026/10/Screenshot-2026-10-14-at-16.29.05.png 1240 2206 Matt Grey https://eventdecision.com/wp-content/uploads/2026/04/mainlogo-ed.png Matt Grey2026-10-14 16:32:022026-10-15 08:00:28Sustainability is business as usual?

More News

  • Sustainability ranks last. That’s your opening.October 21, 2026 - 7:57 pm
  • How far does your stuff travel?October 20, 2026 - 2:21 pm
  • Sustainability is business as usual?October 14, 2026 - 4:32 pm
  • What Event Professionals Actually Want From the Next DecadeSeptember 25, 2026 - 3:01 pm
  • Events create value. Now make it visible.September 24, 2026 - 2:01 pm
  • Why responsible agencies will win more work, whatever the politics.September 23, 2026 - 10:36 am
  • Venues: stop describing your credentials, prove your performanceSeptember 16, 2026 - 8:01 am
  • We’re FIVE!! What’s been going on?September 10, 2026 - 3:04 pm
  • It all matters, but some matters more.August 26, 2026 - 9:19 am
  • What can Uber, Airbnb and Checkatrade teach us about event performance?August 26, 2026 - 7:34 am
  • At last! A simple channel for food rescue…August 18, 2026 - 5:19 pm
  • What event planners can learn from Life Cycle AnalysesAugust 18, 2026 - 12:01 pm
  • About Us
  • Partners
  • Resources
  • Client Login
  • Create An Account
  • Track
  • Impact
  • Navigator
  • Evolve
  • Tel: +44 (0)333 202 6985
  • Email: hello@eventdecision.com
© Copyright 2024 Event Decision | Privacy Policy | Website Design by Lemongrass Media
  • LinkedIn
  • Instagram
Scroll to top