event:decision
  • Home
  • Our Products
    • Track
    • Impact
    • Navigator
    • Evolve
  • About Us
    • Our Company
    • Clients
  • Resources
    • Responsible Futures
    • Blog
    • Responsible Agency Index
  • Contact Us
  • Client Login
  • Search
  • Menu Menu
  • LinkedIn
  • Instagram

It all matters, but some matters more.

August 26, 2026/in event:decision, Third-party Content, Track

Event carbon, without the spreadsheet, for the professional event planner…


Most conversations about a conference’s carbon footprint start with the water bottles. The water bottles are one-tenth of one per cent. Here is where the footprint actually sits – and the handful of decisions that genuinely move it.

If you have ever sat in a sustainability briefing for an event, you will recognise the shape of it. Someone raises reusable cups. Someone else asks whether the delegate bags can be made locally. There is a long and sincere discussion about recycling bins, and everybody leaves feeling that something has been done.

None of this is wrong, exactly. It is just wildly out of proportion to the thing being discussed.

We modelled a fairly ordinary event: a two-day conference, 500 delegates, one overnight, single venue, and around 40% of the audience flying in. The whole thing comes out at roughly 120 tonnes of CO₂e – about what fifteen people in the UK are responsible for in an entire year. Here is how it splits.

Where 120 tonnes actually sits

Modelled two-day conference · 500 delegates · UK venue
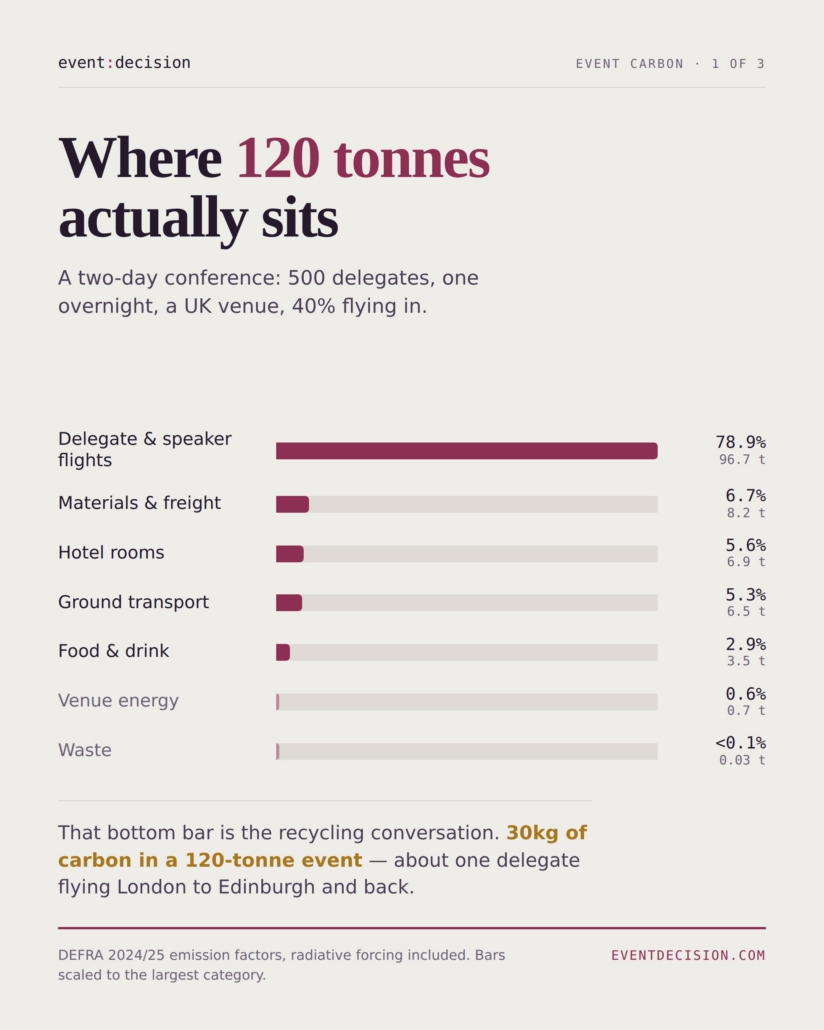
Calculated on DEFRA 2024/25 emission factors. Bars are scaled to the largest category; waste is shown at a minimum width so it remains visible at all.


The useful question isn’t “what’s big”

Knowing that flights dominate is the easy half. The harder and more useful question, if you are the person actually gathering data for a footprint, is: how much detail do I need before the number stops changing?

Because that is where the real cost sits. Chasing a delegate-by-delegate breakdown of who drank which coffee is days of work for an answer that does not move. Meanwhile a single unasked question about flight bookings can shift the total by 40%.

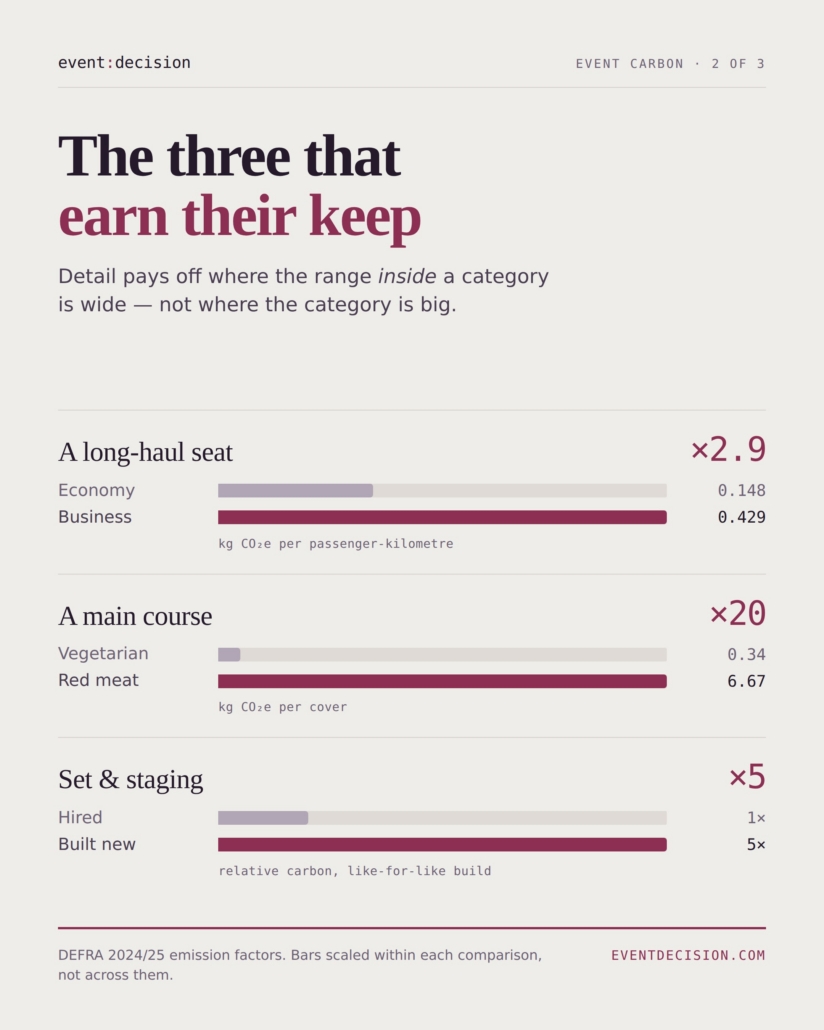
The rule is simpler than it sounds. Detail pays off where the range inside a category is wide — not where the category is large. A category can be enormous and still need only rough data, if everything inside it emits at roughly the same rate. And a small category can demand precision if the options inside it differ by a factor of twenty.

Three questions clear that bar comfortably.
1. Who flew, from where, and in which cabin

A business-class seat takes up roughly three times the aircraft’s fuel per passenger that an economy seat does, because it takes up roughly three times the floor. In our modelled conference, twenty long-haul delegates turning left instead of right adds 73 tonnes – more than half the footprint of the entire event, from a booking decision nobody thinks of as environmental.

So flight data needs to be person-level, or at least route-and-cabin level. What it does not need is precision about airports. Getting the exact terminal pairing rather than a city estimate changes the answer by a percent or two. Getting the cabin wrong changes everything.

2. What was on the plate

Food and drink is under 3% of this event, which surprises people who have been told to feel bad about catering. But the range inside it is the widest of any category on the list: a red-meat main course carries roughly twenty times the carbon of a vegetarian one. Swing the menu from beef-led to a standard 80/20 chicken-and-vegetarian split and the category drops from 8.8 tonnes to 1.9.

Which means all you need from catering is the protein split – how many meat, how many fish, how many vegetarian, per service.

Ingredient-level menus, provenance, food miles, organic certification: interesting, occasionally worth doing for other reasons, but essentially invisible in the number.

3. Whether it was built or hired

Set, staging, exhibition stands and branding are the second-largest category here, and the single biggest variable is not what they are made of but whether they already existed.

Hiring a stand and re-skinning it, versus fabricating one from scratch, is around a five-fold difference. Air-freighting it rather than sending it by road is another six-fold difference on the transport leg.

Both are decisions made early, by procurement, usually on cost and schedule grounds — which is exactly why they need to be visible before the contracts are signed rather than reported afterwards.

Worth knowing, second tier

Three more that matter more than you’d think

  • Which country the hotel is in. A room-night in France is 7.7 kg; the same room-night in Australia is 41.8 kg. That is a six-fold spread driven entirely by the national electricity grid. The hotel’s star rating, by contrast, moves it by about a third – worth capturing, not worth arguing about.
  • How many rooms were genuinely slept in. Assuming every delegate stays every night, when in fact 60% did, overstates accommodation by more than a third. Ask for the rooming list.
  • Whether the venue is on a renewable tariff. This is a yes/no question that can zero out an entire category. It takes one email.

And what you can genuinely stop chasing

This is the liberating part. In a footprint of this shape, the following are all rounding errors, and collecting them to three decimal places is time you will never get back:

  • Coffee, pastries and bottled water counts – about 1.6 tonnes across two days, roughly 1%. This can all be included empirically.
  • Item-by-item AV power draw. A full 60kW rig over a two-day conference comes to 0.3 tonnes. event:decision will calculate this for you.
  • Waste tonnage by stream. 0.03 tonnes. More on this below.
  • Square metreage of every breakout room, and the exact courier distance for every individual delivery.

To be clear: waste still matters.

It is the most visible thing you do, it is what delegates and clients actually see, and it changes behaviour in ways that carry well beyond the event.

Just be honest in the reporting that it is a cultural win rather than a carbon one – otherwise clients spend their sustainability budget where it feels best rather than where it works, and nobody ever tells them.

One important caveat

Everything above describes one event shape: a conference with a meaningful fly-in audience. Change that and the order changes with it. A city conference drawing 90% of its audience from within city limits inverts the whole table – ground transport and materials become the swing factors, and flight precision stops mattering almost entirely. A gala dinner has a fraction of the accommodation and twice the catering intensity. An exhibition stand is mostly materials and freight from the start.

The method survives the change even when the ranking doesn’t. Work out where the wide ranges are for the event in front of you, spend your data-gathering effort there, and use documented defaults for everything else.

Three questions, asked early

  1. Which cabin are we booking, and for whom? The single largest lever on the largest category.
  2. Are we building this, or hiring it? Ask before the design is signed off, not after.
  3. What’s the protein split at each service? The catering team knows. It takes one line on the BEO.
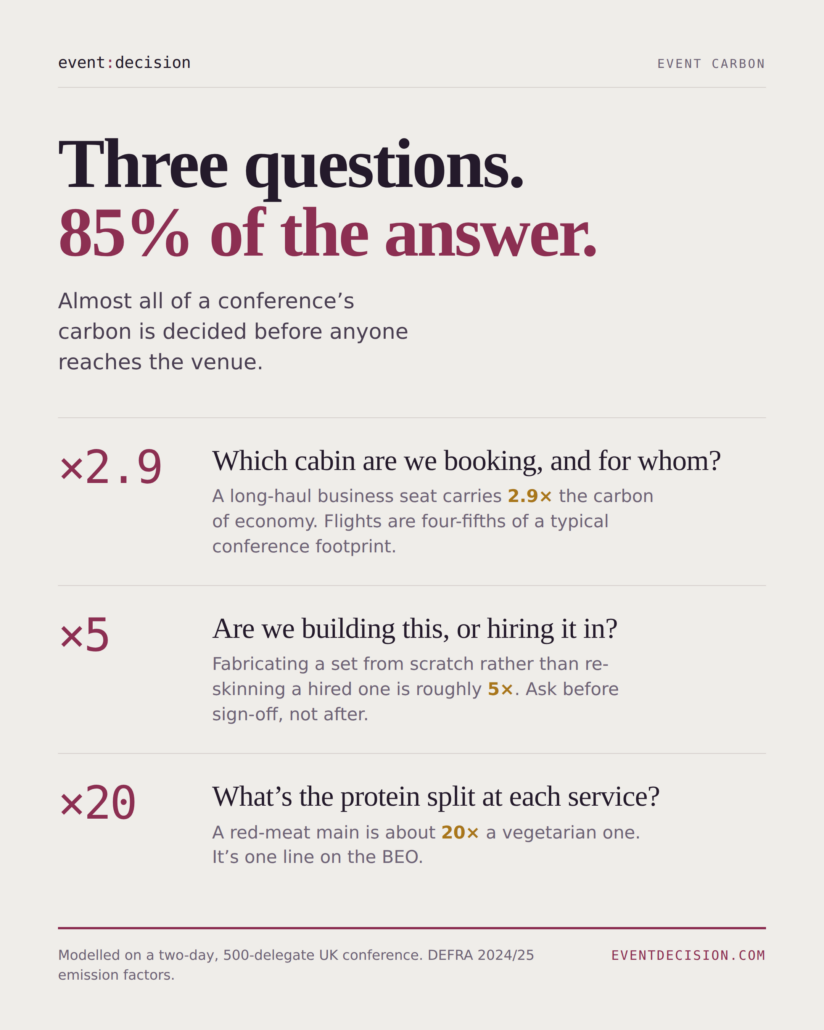
 

Get those three right, and you have roughly 85% of the answer – and, more to the point, you have it at the stage where you can still do something about it.


Figures throughout are modelled on a reference two-day, 500-delegate UK conference using DEFRA 2024/25 emission factors, including radiative forcing on aviation. They are illustrative of proportion and sensitivity, not a benchmark for any specific event.


https://eventdecision.com/wp-content/uploads/2026/08/itallmatters.png 600 1080 Matt Grey https://eventdecision.com/wp-content/uploads/2026/04/mainlogo-ed.png Matt Grey2026-08-26 09:19:002026-08-26 09:19:00It all matters, but some matters more.

The Value You’re Already Creating (And Can’t See)

July 29, 2026/in event:decision, Impact, Track

| event:decision | July 2026

Every event you deliver has an iceberg problem. What the client sees – the room, the stage, the delegate badges, the feedback score, the headline attendance number – is the tip. It’s real, and it’s the part everyone photographs. But it’s a fraction of the mass. The rest – the value the event delivers within its infrastructure and delivery – sits below the waterline, entirely real, and almost never seen.

What’s above the waterline

Ask most event teams how they measure success and you’ll get a strikingly narrow answer. When the Events Industry Council (EIC) surveyed the industry on exactly this question, all eight available answers were commercial: leads, revenue, awareness, deal size. Not one social metric. Not one environmental one. That’s not because operators aren’t creating anything else – it’s because nobody’s ever asked them to look below the waterline, so nobody has.

What’s underneath (and it’s bigger than you think)

Two things sit beneath every event you deliver, fully formed and entirely uncounted.

The first is environmental: every flight, hotel room, kilowatt hour, meal and metre of freight your event consumed had a carbon cost, whether or not anyone wrote it down.

The second is social – this one is hugely positive and larger than you think. event:decision’s own analysis puts the social value an event generates at 10–30% of its budget; the relationships built face-to-face, the skills transferred, the local jobs supported, the spend that landed in the host city’s cafés and crews. Scaled across the sector’s $1.3 trillion of direct spend, that’s the “$260bn blind-spot” the industry’s own flagship economic study admits “goes unmeasured, unreported, and therefore undervalued.” On a single £500k event programme, that’s £50k–£150k of value delivered and never once put on the table.

Even the destinations selling events for a living have the same gap. The Business of Events’ Global Destination Report 2026 found destinations believe deeply in the sustainability and legacy case for their business – but “almost none can evidence it.” One European city representative admitted sustainability “is not yet usually the first thing clients ask for,” and only becomes persuasive “when concrete measures are presented.” The report’s own fix — fund “a small number of repeatable impact studies” — is, in effect, a call for exactly the measurement infrastructure Track and Impact already provide.

Created everywhere, claimed nowhere

The value isn’t missing. It’s unclaimed. Every event you ran this last year generated it – and then it evaporated, as far as anyone can prove: no number, no line in the report, no mention in the client’s board paper, no credit in your next pitch. Created in full. Claimed at zero.

“The social value was real – the relationships, the skills, the local spend all happened. But unmeasured value is unclaimed value.”

Until you can put a figure next to what you built, “we’re committed to making a difference” is a sentence every competitor also owns. A number isn’t.

Track surfaces the environmental mass you can measure in tonnes

Track exists to pull that environmental mass up above the waterline without adding to the planner’s workload. No data input, no spreadsheets, no conversion factors, no report-building.

Track is a managed service that does the heavy lifting so you don’t have to.

You get the event’s carbon footprint, industry benchmarking against the 200+ events already measured, event-specific mitigation recommendations, and, where it’s genuinely needed, a certified offset route for whatever’s left. It measures before it mitigates, and mitigates before it ever reaches for an offset.

Impact surfaces the rest

Impact: Event does the same job for everything Track can’t put a tCO₂e figure on: the fair pay, the local hiring, the accessibility provision, the accessibility commitment, the community legacy – the value that goes completely unmeasured in almost every post-event report written today.

SaVY, our Social Value Yield metric, gives it the same treatment carbon got a decade ago: one number, in £ or as a % of budget, covering your event, your supply chain and your organisation.

And because clients are asking the ESG question earlier and harder every quarter – the latest RFP event:decision is supporting lists sustainability as a scored “must,” not a nice-to-have – having that number ready before you’re asked for it isn’t a differentiator any more. It’s table stakes.

Why this only works if it’s honest

None of this is worth anything if it isn’t true, which is why both tools are built to check what actually happened, not flatter whoever paid for the report. Independent, third-party measurement means an event’s environmental and social claims can actually be verified rather than simply asserted – which is exactly what protects you the day someone asks you to prove it. That’s the whole point of measuring in the first place: candour, not decoration.

The part agencies keep missing

Claim the value and something changes: it compounds. It isn’t one report for one client – it’s a benchmark, a body of evidence, and a running total that gets stronger every time you measure the next event. The client gets the proof. You keep the intelligence: the peer benchmarks, the year-on-year story, the case for your next three pitches. That’s the difference between creating value and being able to prove you created it.

Look below the waterline

You’re not being asked to run a more sustainable event, or a more socially valuable one, than the one you’re already running.

You’re being asked to look below the waterline at the event you already delivered. Most of what’s down there, you built. It’s just never been counted.

Put a number on what your next event is already creating – talk to us about Track and Impact at hello@eventdecision.com

https://eventdecision.com/wp-content/uploads/2026/04/mainlogo-ed.png 0 0 Matt Grey https://eventdecision.com/wp-content/uploads/2026/04/mainlogo-ed.png Matt Grey2026-07-29 09:14:582026-07-29 09:14:58The Value You’re Already Creating (And Can’t See)

Business Travel Growth Forecast

October 7, 2025/in event:decision, Impact, Track

Business Travel Growth Forecast: what impact for events?

Almost half of corporates to spend more on business travel in FY26, is the forecast by FCM Travel. Excellent news if you’re in the business of travel, and for that matter, probably if you’re in the business of meetings and events.

It indicates more opportunities for face-to-face engagement, collaboration, and the overall growth of the events sector. However, it also raises questions about sustainability, as increased travel is traditionally associated (read, absolutely associated) with higher carbon emissions, hence event carbon footprints.

How does this square with oft-quoted event planning agencies promising reduced environmental impacts?

This is exactly where event:decision Impact: Responsible Event Reviews are crucial. Impact Reviews help ensure that even as volumes of events and travel increase, sustainability is embedded and demonstrable.

How you show your events are responsible:

  1. Measure Beyond Carbon

Impact Reviews assess events across environmental, social, and governance (ESG) factors, not just carbon emissions. This includes venue sustainability, catering choices, accessibility, certifications, waste reduction, supply chain responsibility and event legacy. Balancing travel impacts with positive social and governance measures.

  1. Benchmarking & Improvement

Each event is benchmarked against industry performance and previous events. You can demonstrate year-on-year improvement, even if travel volumes rise, by showing better destination & venue sourcing, reduced waste, increased local supply and stronger community benefits.

You can benchmark by region, by industry sector and/or by event-type also.

  1. Offsetting & Mitigation

event:decision tools highlight opportunities for carbon reduction and offsetting, such as virtual attendance options, low-carbon menu choices, and more sustainable transport alternatives. In fact, only with event:decision’s Track Carbon service do you receive a curated low-carbon door-to-door travel plan, specifically for your event.

 This ensures travel impact is acknowledged but managed in line with best practice.

  1. Transparency & Reporting

An Impact: Responsible Event Review provides a clear, third-party validated framework that you can use in sustainability reporting. This helps counterbalance any criticism that “more travel = less sustainable,” by showing that events are planned responsibly, transparently, and within ESG frameworks.

The big picture

Even as corporate travel spend rises, responsible event design can ensure that events are still responsible & sustainable. The key is to show stakeholders — through Impact: Responsible Event Reviews — that the event is measured, benchmarked, and actively improved, time after time.

https://eventdecision.com/wp-content/uploads/2025/09/ED-Web-Graphics-Blog-Post-images.png 768 1024 Laura Robinson https://eventdecision.com/wp-content/uploads/2026/04/mainlogo-ed.png Laura Robinson2025-10-07 09:20:072025-10-07 09:16:36Business Travel Growth Forecast

Better by design

September 23, 2025/in event:decision, Impact, Track

How to win and deliver better events

Audiences, stakeholders, and regulators increasingly expect events to deliver positive outcomes for both people and the planet. Meeting these expectations requires more than good intentions; it calls for collaboration, insight, and action. That’s where a strong partnership between event:decision and trusted suppliers makes all the difference.

Last week event:decision and PSP showed how this is done.

How did it go? We’ll let the stats speak for themselves:

  • 100% attendance rate
  • 95% retention rate for the whole event.

Appetite from event agencies is there. A good start all round.

What did they learn?

  1. The event sector is improving. Projects that event:decision report from May-24 to May-25 show an average of 3pts improvement across ESG over this period.
  2. That major regional differences still exist. No surprise really, given geographical, political and economic drivers behind event sustainability. More info here.
  3. Client sectors also vary. More info here. 

The Engines of Improvement

At the heart of this collaboration are Track and Impact, event:decision’s leading tools for responsible event management.

Track is the leading global carbon reporting and advisory service for events. It enables organisers and suppliers to measure the emissions of each event with precision, revealing where improvements can be made. From venue energy use to delegate travel, Track provides the data to identify hotspots and guide meaningful reductions.

Impact, meanwhile, takes a broader ESG approach. It evaluates the environmental, social, and governance aspects of an event, offering a comprehensive Responsible Event Review. Impact benchmarks performance across key areas—such as locality, accessibility, and community / social engagement—helping teams set goals and track progress over time.

Together, these tools turn every event into an opportunity for improvement. By measuring, benchmarking, and reporting on performance, Track and Impact transform responsibility from a one-off exercise into a cycle of continuous learning.

Why Partnership Matters

A joint event:decision and supplier partnership ensures that data and action go hand in hand. Suppliers receive clear, actionable insights, empowering them to adapt their services and reduce impact. Organisers gain confidence that every element of the supply chain is working toward the same goals. The result? Events that not only meet sustainability targets but also inspire audiences and stakeholders with tangible proof of positive change.

Every event—large or small, live or virtual—can be better than the last. By partnering with event:decision and leveraging Track and Impact, suppliers and organisers can demonstrate leadership, deliver responsible events, and build a legacy of continuous improvement.

https://eventdecision.com/wp-content/uploads/2025/09/Screenshot-2025-09-21-at-17.55.47.png 842 924 Laura Robinson https://eventdecision.com/wp-content/uploads/2026/04/mainlogo-ed.png Laura Robinson2025-09-23 09:00:052025-09-21 17:57:47Better by design

Introducing ‘Factor-30’ Benchmarking

September 5, 2025/in event:decision, Impact, Track

Factor-30 Industry Benchmarking

At event:decision, we’re committed to giving you the tools you need to make your events not only successful, but also responsible and sustainable.

An Impact: Responsible Event Review already gives you a comprehensive view of how your events and your organisation performs across environmental, social, and governance (ESG) measures. Now, we’re taking that insight even deeper.

‘Factor-30’, granularity to drive change

Impact Review’s latest feature enables you to view your performance across 30 individual ESG factors. Rather than seeing sustainability and responsibility as a single overall event score, you can now see precisely where your event excels – and where there’s room to improve.

This means:

  • Clear visibility into performance across all three ESG pillars – from carbon and waste management to supply-locality, well-being and governance practices.
  • The ability to pinpoint priority areas, making your action planning more focused and effective.
  • A more balanced perspective, recognising successes in some areas even if others need further attention.

Industry Benchmarking – see where you stand

We’ve also introduced comparisons against industry performance for each factor. This means you don’t just see how you’re doing internally, you understand how your event measures up against the wider industry landscape.

Key benefits include:

  • Ability to fine-tune your event, your bid or RFP for success.
  • Benchmark confidence: Knowing where your event outperforms the industry builds confidence in your responsible event strategy.
  • Competitive insight: See how you stack up against your peers and where you can create differentiation.
  • Evidence for stakeholders: Concrete, comparative data makes it easier to communicate progress and justify investment in sustainability and responsibility initiatives.

From data to action

The real value of this update lies in the ability to translate insights into tangible improvements. With clarity across 30-factors and a clear view of industry benchmarks, you can:

  • Set targeted improvement goals.
  • Share clear, compelling reporting with sponsors, clients, and internal teams.
  • Demonstrate a genuine commitment to continuous improvement in responsible event delivery.

Why It Matters

Events have the power to connect, inspire, and create change – but they also carry responsibility. By shining a light on performance at the factor level and providing meaningful benchmarks, Impact Reviews now make it easier than ever to make better, more responsible choices.

As an event industry, you have already demonstrated improvement from 2024 through 2025.

Here’s your chance to accelerate this positive change.

(Oh, and it’s already included in your Impact Dashboard Reporting at event:decision, at no extra charge)

At event:decision, we believe that performance, authenticity and responsibility go hand in hand. With Impact Reviews, we’re helping our industry take another step forward, making your events just that little bit better, time after time.

https://eventdecision.com/wp-content/uploads/2025/09/factor30-1.png 768 1024 Laura Robinson https://eventdecision.com/wp-content/uploads/2026/04/mainlogo-ed.png Laura Robinson2025-09-05 13:50:082025-09-09 11:35:59Introducing ‘Factor-30’ Benchmarking

Sustainability in focus

August 26, 2025/in event:decision, Impact, Track

Who’s leading (and who’s lagging) in events by sector.

At event:decision, we’ve seen sustainable event planning take a leap forward in 2025 -not just in ambition, but in measurable outcomes. With more organisations benchmarking their events across Environmental, Social, and Governance (ESG) factors, we’re gaining a clearer picture of where the industry is maturing, and where it still needs a nudge.

But the real story lies in the sector-specific differences. Here’s what the data shows about which industries are pushing the boundaries, and which are falling behind.

Top performer: Events & hospitality

This year’s biggest leap came from the Events & Hospitality sector, particularly in environmental impact. From energy use to food sourcing, this group is turning intent into action.

Why they stood out:

  • Greener menus: More plant-based, local, and seasonal sourcing.
  • Sustainable venues: Prioritising those powered by renewables.
  • Waste control: Advanced recycling plans and zero-to-landfill targets.

Environmental scores rose sharply compared to 2024, making Events & Hospitality the standout sector for sustainable progress this year.

Second in line was Finance and Legal…

While Events & Hospitality led the environmental charge, Finance and Legal sector events stood out for their exceptional Governance performance – making them the second-strongest overall.

Why they ranked high:

  • Clear ESG accountability: Governance practices from core business operations are mirrored in event planning.
  • Rigorous supplier due diligence: Preferred partnerships with accredited vendors.
  • Policy-driven decisions: Events aligned tightly with internal compliance and risk protocols.

Governance scores were consistently high across Finance and Legal events, pulling their overall ESG performance into the top tier.

Lowest performer: Retail & Consumer goods

Despite facing the public eye daily, the Retail and Consumer goods sector ranked lowest overall in sustainability performance, especially in governance and social impact.

Key challenges:

  • Short planning cycles, leaving little room for ESG integration.
  • Budget sensitivities, with sustainability still perceived as a cost add-on.
  • Low measurement adoption, meaning missed opportunities for improvement.

Without clear measurement or set goals, many events in this sector failed to meet even baseline expectations.

What the gap tells us

This contrast shows just how vital measurement and mindset are. The Events & Hospitality sector proved that with intention, planning, and the right tools, major progress is possible, even in complex environments. Meanwhile, Retail’s slower shift suggests a need for sector-specific support, clearer ROI messaging, and more accessible sustainability solutions.

Where we go from here

We know that when planners measure, they change. And now, with better reporting platforms, smarter advisory support, and real-time benchmarking tools like Impact and Track, event professionals can act with confidence – not guesswork.

Let’s make 2025 the year every sector finds its stride.

https://eventdecision.com/wp-content/uploads/2025/08/Copy-of-sustainability-hero-event-decision-web-sized-2.png 768 1024 Laura Robinson https://eventdecision.com/wp-content/uploads/2026/04/mainlogo-ed.png Laura Robinson2025-08-26 09:00:492025-08-11 09:44:57Sustainability in focus

Region watch: US & EMEA

August 12, 2025/in event:decision, Impact, Track

Who’s leading on event sustainability in 2025?

As more organisations commit to responsible event delivery, 2025 has become a landmark year for measured progress. At event:decision, our data tools – including Track and Impact Reviews, provide a uniquely detailed view of how event sustainability is evolving across industry sectors, event types, and geographies.

This time, we’re zooming in on the regional picture. Specifically: how do events in the US compare to those in EMEA?

The answer isn’t just a matter of who scores higher. It’s about what’s driving performance, what cultural and structural factors are influencing results and what both sides can learn from each other.

EMEA leads the way, for now

In 2025, EMEA emerged as the highest-performing region overall, driven by stronger results in Environmental and Governance pillars.

Why EMEA events stood out:

  • Stronger supply chain transparency, particularly in the UK, Netherlands, and Nordics.
  • More established ESG reporting culture, with sustainability metrics often mandated internally at client-board-level.
  • Higher event planner awareness, especially among agencies serving European or global clients.

EMEA events scored significantly above average in Governance – with consistent use of certified suppliers, carbon goal setting, and more detailed post-event reporting.

US: Strong intent, but gaps in execution

US-based events demonstrated real commitment to sustainability in 2025 but scores were more variable, particularly in the Social and Governance dimensions.

Key challenges for US events:

  • Lower consistency in carbon tracking, especially for travel.
  • Less structured supplier vetting, often driven by speed and budget.
  • Underuse of measurement tools, leading to lower benchmarking confidence.

That said, there are bright spots. Some corporate event teams in the US are piloting portfolio-wide ESG frameworks, a sign that momentum is building.

We see US-corporates pushing their agencies hard for benchmarks and pathways, especially in CDP &/or Ecovadis products.

The biggest hurdle? A lack of enforced standards. Where EMEA planners often face regulatory or procurement-driven requirements, US teams rely more on voluntary adoption, making measurement and improvement patchier.

Regional takeaways: What we’re seeing

Factor EMEA US
Average ESG Score Higher Lower (more varied)
Governance Strong – compliance driven Inconsistent – depends on team maturity
Environmental Strong in travel, waste, sourcing Variable – hybrid models help, but gaps in tracking remain
Social Improving, esp. around wellbeing & access Patchy – DEI efforts exist but aren’t always measured

What EMEA can learn from the US: Greater innovation, especially in hybrid and tech-led formats.

What the US can learn from EMEA: Standardise measurement and make ESG mandatory.

What’s next: Closing the gap

Sustainability isn’t a static factor. What we’re seeing now is a regional maturity curve and with the right tools, both EMEA and US-based planners can keep advancing. The difference? EMEA is starting to treat ESG as a business necessity. The US is still treating it like an opportunity, risking inconsistent delivery.

That’s where event:decision comes in.

  • Track your event performance, not just in carbon but in social value and governance process
  • Benchmark against regional peers, but also in client-sectors and event-types
  • Act with confidence, not guesswork.
  • All for less than the price of a single hotel room.

https://eventdecision.com/wp-content/uploads/2025/08/Copy-of-sustainability-hero-event-decision-web-sized-.png 768 1024 Laura Robinson https://eventdecision.com/wp-content/uploads/2026/04/mainlogo-ed.png Laura Robinson2025-08-12 09:00:162025-08-11 09:44:23Region watch: US & EMEA

Every story has a number, every number has a story

July 22, 2025/in event:decision, Impact, Track

Great at Stories. Awful at Numbers. That’s #Eventprofs for you.

Let’s face it: as an industry, event planners are brilliant at crafting a compelling story.

We can take a spreadsheet of logistics and turn it into an experience that moves people. When it comes to sustainability, we know the right things to say. We talk about reusable cups, compostable lanyards, local vegan food. We highlight our commitments to people, planet, and purpose. The story sounds great in the sustainability report—and better still in the pitch deck.

But here’s the problem: we’re great at the story, and frankly, terrible at the numbers.

Ask most event professionals to quantify the carbon savings of switching to LED lighting, or the measurable social impact of using a local vendor network, and the numbers just… aren’t there. At best, we see vague metrics or arbitrary benchmarks. At worst, we see none at all.

And yet, numbers matter. They bring credibility to our sustainability narratives. They turn well-meaning gestures into accountable action. They make the difference between “we tried” and “we achieved.”

That’s where Impact: Responsible Event Reviews come in.

Impact Reviews give event planners a clear, evidence-backed framework for assessing the sustainability and social responsibility of an event. No fluff, no guesswork—just meaningful insights grounded in ESG principles. It evaluates dozens of data points across your planning decisions, scores them against international performance, and provides a simple, shareable report that tells both the story and the numbers.

In fact, many of our clients start with a great narrative—but it’s Impact that brings it to life with substance. It shows where you’re doing well, where you can do better, and what progress looks like over time. It’s not about catching anyone out. It’s about making better decisions, every time.

So let’s keep telling great stories. Let’s keep showing that our events can be a force for good. But let’s also bring the numbers. Because every story has a number. And every number, a story.

Ready to back your sustainability story with numbers that matter?

Get in touch to try Impact today.


* Aswath Damodaran, a finance professor at NYU Stern, is associated with the phrase “Every number tells a story, and every story has a number” although this is not a direct quotation.

https://eventdecision.com/wp-content/uploads/2025/06/Copy-of-sustainability-hero-event-decision-web-sized-2.png 768 1024 Laura Robinson https://eventdecision.com/wp-content/uploads/2026/04/mainlogo-ed.png Laura Robinson2025-07-22 09:00:402025-06-18 17:11:58Every story has a number, every number has a story

Who should pay for sustainable events?

July 8, 2025/in event:decision, Impact, Track

Who pays for sustainability?

If you’re in sales, account development, client direction or the owner of an events agency here’s a simple guide to growing your business.

You’re always asking us “Who should pay for the cost of our environmental and social efforts? Should we increase prices so the customer pays, or should we absorb from within our margin?”

The answer is that neither you nor the customer should pay — make your competitors pay.

Improving your own event performance, and making sure customers know that, naturally increases customer preference for your proposition.  We’re always being told that RFPs now include mandatory sustainability sections, in fact we answer a few of them for agencies ourselves.  Now is your chance to turn this section into a bid-winner.

You win market share.

Who pays? Your competition.

Particularly laggards. And there’s plenty of them.

“We’re too busy to look at sustainability” we heard only this week. Good for you & good for now. They’ll get found out. Let’s hope that agency owner sells up while they still can.

“Can you help? All our incoming RFP’s demand proof of sustainability, but when push comes to shove, we don’t actually know what we’re doing”, we were told in Frankfurt recently by a large well-known global agency.

This is exactly as it should be — those who are not keeping up in terms of acting on published responsibility & sustainability values also shoulder the resulting costs.

Global research from PWC shows that big business knows & demonstrates what it’s doing in respect of responsible business practice and sustainability numbers:

  • Low carbon products are considered<25% more valuable. And yes, event can be termed low-carbon products, if you engineer it as such.
  • Twice as many companies are strengthening sustainability targets as are weakening them (yes, even with macro-political environments)
  • 9x more companies have carbon targets than did only five years ago.

So to prove how good you are at delivering responsible & sustainable events (beware, this tool really does sort the wheat from the chaff), try an Impact: Responsible Event Review.

Demonstrate how good your proposal is compared to your peers. Tell the compelling story and accompany with independent, expert, verifiable benchmarking.

Or else it’ll be you paying.

https://eventdecision.com/wp-content/uploads/2025/06/Copy-of-sustainability-hero-event-decision-web-sized-1-1.png 768 1024 Laura Robinson https://eventdecision.com/wp-content/uploads/2026/04/mainlogo-ed.png Laura Robinson2025-07-08 09:00:452025-07-08 08:30:55Who should pay for sustainable events?

1st & 2nd Quarter 2025 – Sustainability Review

June 24, 2025/in event:decision, Impact, Track

Raising the Bar: What 2025 is teaching us about responsible events

It’s been just over a year since event:decision started benchmarking responsible event delivery, using an E, S and G framework. Already, the movement is positive. What began as a handful of forward-thinking planners asking the right questions is fast becoming embedded in the planning process across regions, sectors, and event types.

In 2025, we saw the number of organisations choosing to measure their event sustainability, grow significantly – and not just in carbon. The insights speak volumes, not just about how we plan, but why measurement matters if we want to deliver meaningful change as an industry

At event:decision, we provide proof points for responsible planning, by measuring the sustainable performance of your event. Our proprietary tools and services with which we support the industry, are:

  1. Track, event carbon audit & advisory services.
  2. Impact: Responsible Event Reviews provide ESG assessments, benchmarking and certification for responsible event planning.
  3. Evolve, show, association, and services, including our Exhibitor Sustainability Recognition scheme.

All three widely used by event agencies, planners and corporates, driven by commercial factors, by legislative demand and, dare we say, a moral imperative to deliver events ‘better’.

Coming soon: a new way of working for Corporates. Think more strategic, campaign-led, integrated sustainability across event portfolios – more on that to follow in July.

2025 In Numbers – What’s Changed?

Compared to 2024, 2025 events made a noticeable leap in average sustainability scores. Social impact, in particular, saw a step-change. Meaning more organisations are embedding locality, wellbeing, and community values into how they deliver.

“In just 12 months, we saw total scores rise by more than two points on average.”

Here’s where it gets interesting…

Across all events, the average sustainability score in 2025 rose notably over previous years, with improved performance in environmental and governance pillars in particular.

On average, events achieved a total score of 19.07, up from 16.95 in 2024.

What the Data Shows – and Why it Matters

This unique breakdown gives us real insight, not just into where performance is improving, but where the opportunities still lie.

  • By Region – EMEA events led the way overall — likely helped by stronger reporting culture and supply chain transparency.
  • By Sector – Finance and legal firms’ events hit high governance scores. But it’s the events & hospitality sector where we saw the biggest environmental progress, from smarter menus to greener venues.
  • By Event Type – Internal meetings led overall, but exhibitions were more varied. That said, when expos did engage with measurement, they often scored well, particularly on governance.

Beyond the Numbers: What Needs Attention

We still see some barriers holding organisers back. Here are a few we’re keeping an eye on:

  • Travel emissions remain the biggest contributor, and often the hardest to influence. (Hint: you can get to grip with Travel using event:decision’s Track reporting. We’re the ONLY provider of the leading travel demand management platform for destinations, venues, and live events, You.Smart.Thing.)

  • Social enterprises are still underused. The appetite is there, but more visibility and guidance would help to avoid the ‘but this is how we’ve always done it’ mindset. Many planners are unaware of where to source & vet potential providers in this space. (Hint: there are several within our Impact Review tool)

  • Budgets are getting tighter and with the perception that sustainability is more expensive, this is often a barrier to measurement. (Hint: the real answer to “Who should pay for sustainable events?” is simple. Make it your competition.
  • Fewer than 25% of events set an impact or carbon goal before delivery – a huge missed opportunity. Agencies in particular, should note.

Nudging Change, Together

If there’s one thing this year confirmed, it’s this: when planners measure, they change.

That might mean swapping suppliers for social enterprises. Often on price parity. It might mean thinking differently about travel and accessibility. It might just mean asking more of your venue.

And we get it – change isn’t always easy. But we make it much, much simpler.

What’s Next: Act with Confidence, Not Guesswork

Event:decision will continue to add value to the event sector with Impact Reviews, in use globally and across all sectors.

Did you know we now give you real-time guidance on each and every factor you review as you progress through the review tool? So you can see who’s doing what and how you compare…

We’re focusing more on partnerships, not just platforms. Now, with more tailored support for corporate programmes, increased awareness, better reporting tools = better “real” data, more precision in benchmarking, you can tie metrics to your overall ESG goals and make adjustments that have real impact.

Contact us for more information on how we can help you measure your next event.

https://eventdecision.com/wp-content/uploads/2025/06/Copy-of-sustainability-hero-event-decision-web-sized-3.png 768 1024 Laura Robinson https://eventdecision.com/wp-content/uploads/2026/04/mainlogo-ed.png Laura Robinson2025-06-24 09:00:492025-06-27 12:07:271st & 2nd Quarter 2025 – Sustainability Review
Page 1 of 6123›»

More News

  • What Event Professionals Actually Want From the Next DecadeSeptember 25, 2026 - 3:01 pm
  • Events create value. Now make it visible.September 24, 2026 - 2:01 pm
  • Why responsible agencies will win more work, whatever the politics.September 23, 2026 - 10:36 am
  • Venues: stop describing your credentials, prove your performanceSeptember 16, 2026 - 8:01 am
  • We’re FIVE!! What’s been going on?September 10, 2026 - 3:04 pm
  • It all matters, but some matters more.August 26, 2026 - 9:19 am
  • What can Uber, Airbnb and Checkatrade teach us about event performance?August 26, 2026 - 7:34 am
  • At last! A simple channel for food rescue…August 18, 2026 - 5:19 pm
  • What event planners can learn from Life Cycle AnalysesAugust 18, 2026 - 12:01 pm
  • Your performance data walks out the doorAugust 17, 2026 - 5:06 pm
  • Social Value is moving upstairsAugust 3, 2026 - 2:56 pm
  • Client gets the proof. You keep the intelligence.August 3, 2026 - 7:31 am
  • About Us
  • Partners
  • Resources
  • Client Login
  • Create An Account
  • Track
  • Impact
  • Navigator
  • Evolve
  • Tel: +44 (0)333 202 6985
  • Email: hello@eventdecision.com
© Copyright 2024 Event Decision | Privacy Policy | Website Design by Lemongrass Media
  • LinkedIn
  • Instagram
Scroll to top